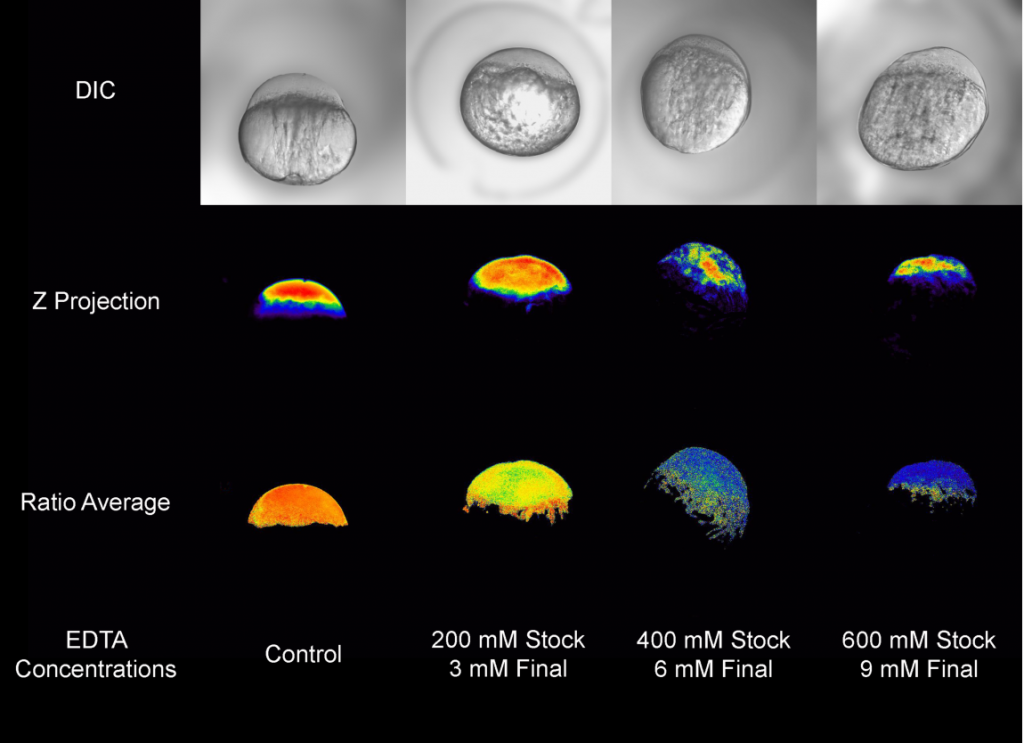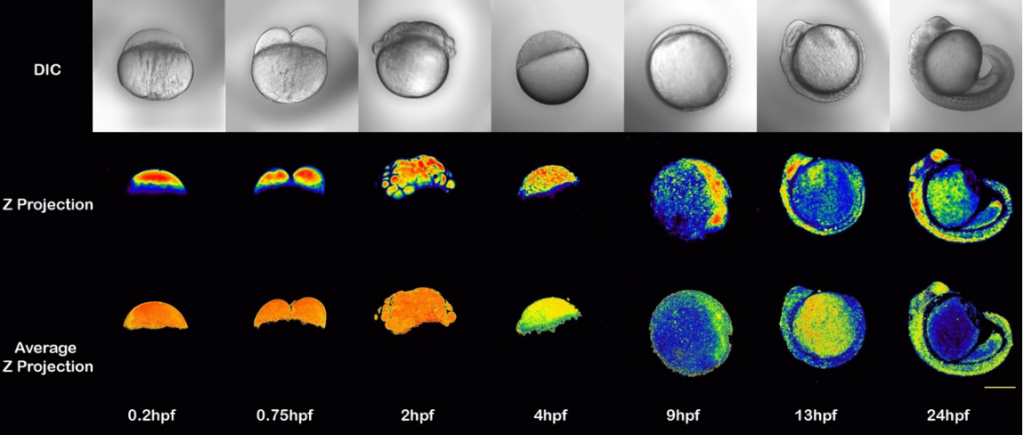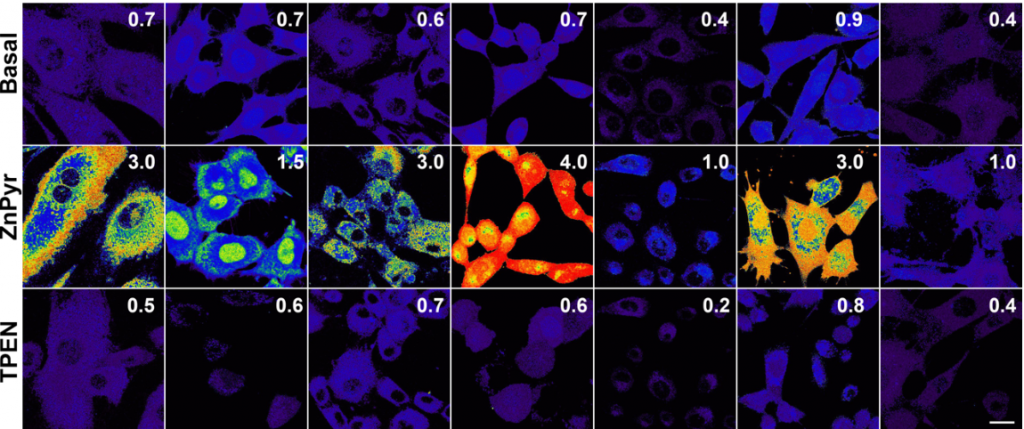
All images/data below were acquired and created by Dr. Bourassa for publications and presentations.
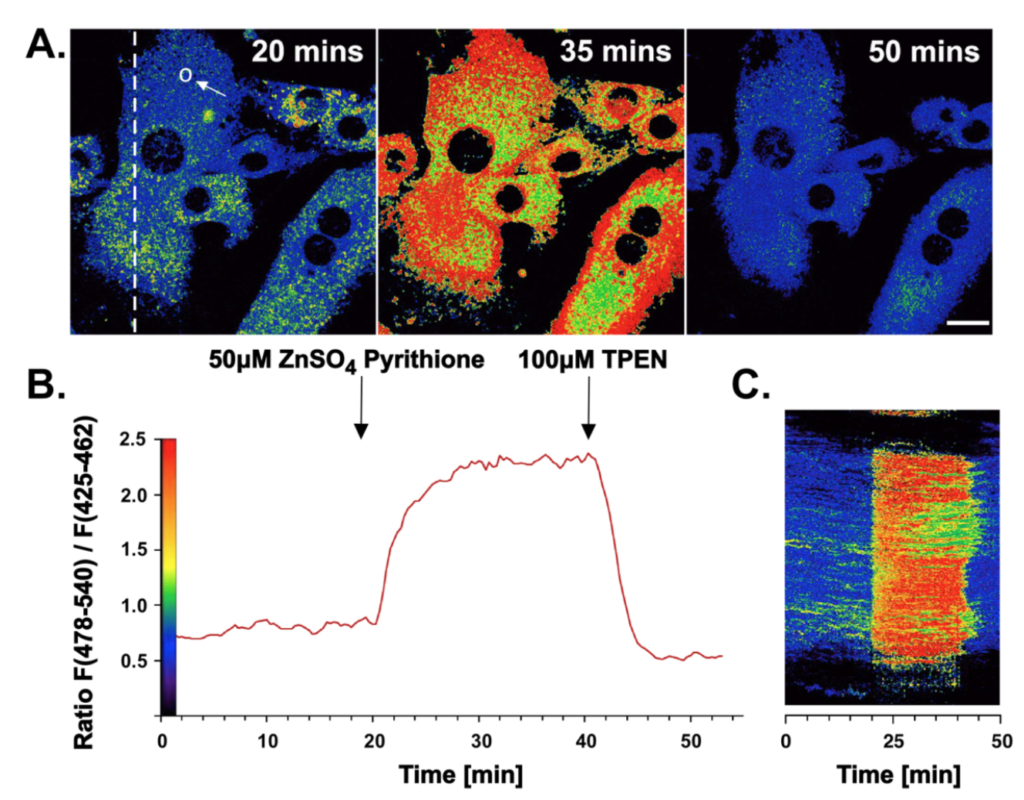
Ratiometric response to addition of ZnSO4 and TPEN. Two-photon excited ratiometric imaging of Zn(II) fluxes in live 3T3 fibroblasts. Cells were treated with 10 μM Chromis1-ester then imaged inside of a temperature-controlled chamber mounted on the microscope stage. After 20 minutes, the cells were exposed to a buffer solution containing 100 μM ZnSO4 / pyrithione followed by a second buffer containing 100 μM TPEN at the 41-minute mark. A: False color ratiometric images acquired at the indicated time points. B: Average intensity ratio change vs. time for the region of interest shown as a circle in the left panel of (A). C: False color ratiometric kymograph for the region of interest shown as a dotted line in the left panel of (A). Two-photon excitation occurred at 720 nm, the emission was collected between 425-462 and 478-540 nm. Scale bar = 20 μm.
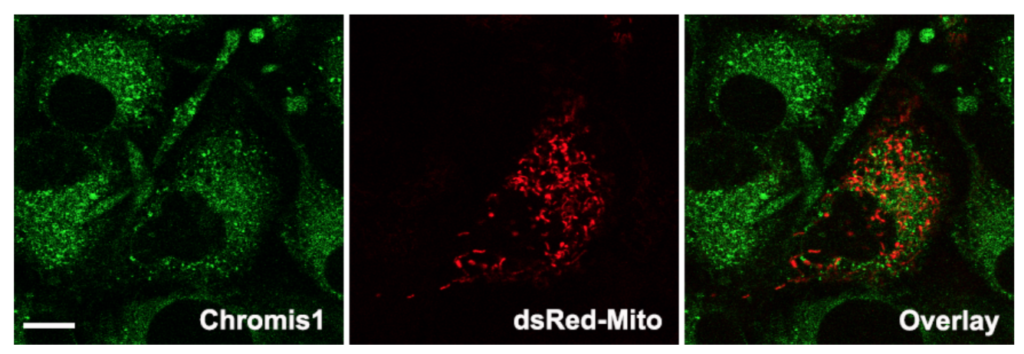
Spatial correlation analysis of Chromis1-ester with mitochondria in 3T3 cells. (Left) Epifluorescence image of Chromis1-ester excited via a pulsed IR/multiphoton laser tuned to 720 nm, emission collected 400 – 498 nm. (Center) Epifluorescence image of mitochondria labeled via transfection of pDs_Red2-mito, excited at 561 nm, emission collected 570 – 700 nm. (Right) Overlay image indicating the negligible amount of spatial correlation between Chromis1-ester and pDs_Red2-mito in orange/yellow color, corresponding to a Pearson correlation coefficient of 0.19. Scale bar = 20 μm.
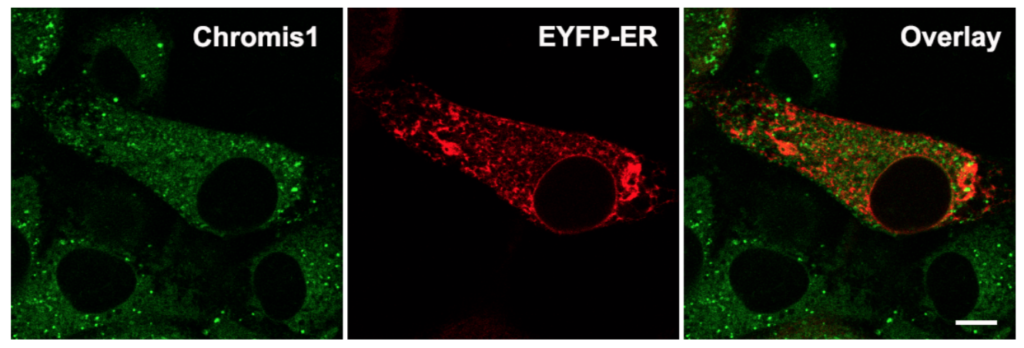
Spatial correlation analysis of Chromis1-ester with ER in NIH 3T3 fibroblasts. (Left) Epifluorescence image of Chromis1-ester excited via a pulsed IR/multiphoton laser tuned to 720 nm, emission collected 400 – 498 nm. (Center) Epifluorescence image of ER labeled via transfection of pEYFP-ER, excited at 514 nm, emission collected 525 – 675 nm. (Right) Overlay image indicating the amount of spatial correlation between Chromis1- ester and pEYFP-ER in orange/yellow color, corresponding to a Pearson correlation coefficient of 0.38. Scale bar = 20 μm.
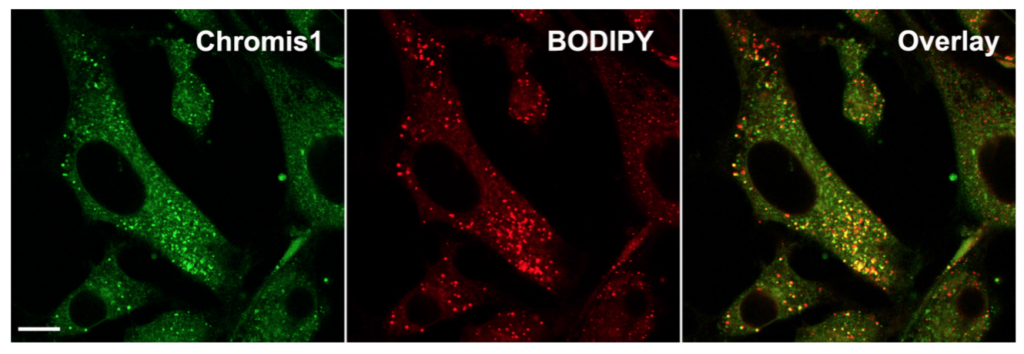
Spatial correlation analysis of Chromis1-ester with lipid droplets in NIH 3T3 fibroblasts. (Left) Epifluorescence image of Chromis1-ester excited via a pulsed IR/multiphoton laser tuned to 720 nm, emission collected 400 – 498 nm. (Center) Epifluorescence image of lipid droplets labeled via BODIPY 493/503, excited at 488 nm, emission collected 525 – 675 nm. (Right) Overlay image indicating the amount of spatial correlation between Chromis1-ester and BODIPY 493/503 in orange/yellow color, corresponding to a Pearson Correlation Coefficient of 0.67. Scale bar = 20 μm.
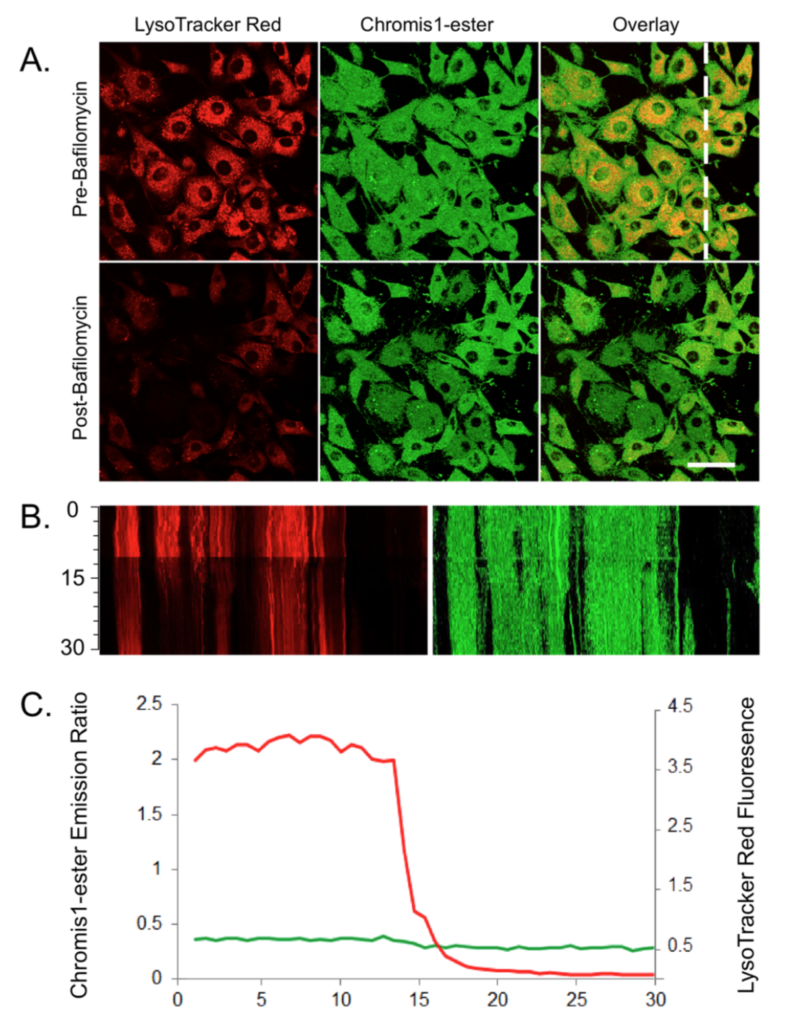
Chromis1-ester response to neutralization via Bafilomycin. Imaging of Chromis1-ester and LysoTracker Red treated live NIH 3T3 fibroblasts. Cells were pre- treated with 10 μM Chromis1-ester and 6 nM LysoTracker Red then imagined in a temperature-controlled chamber using a Zeiss LSM710. The cells were then exposed to 900 nM Bafilomycin. A: False color imaging pre- and post-Bafilomycin addition of LysoTracker Red (left), Chromis1-ester (center) and an overlay of the two (right). Scale bar = 50 μm. B. False color kymographs of LysoTracker Red (left) and Chromis1-ester (right) for the region of interest shown as a dotted white line in upper right panel of (A). Time scale on the far left, 0 – 30 minutes. C. Average intensity of emission ratio of Chromis1-ester (green line) and the fluorescence of LysoTracker Red (red line) over the 30 minutes of time-lapse imagining. Two-photon excitation of Chromis1-ester occurred at 720 nm and emission was collected between 425-462 and 478-540 nm. LysoTracker Red was excited using a 561 nm laser and emission was collected between 584-612 nm.
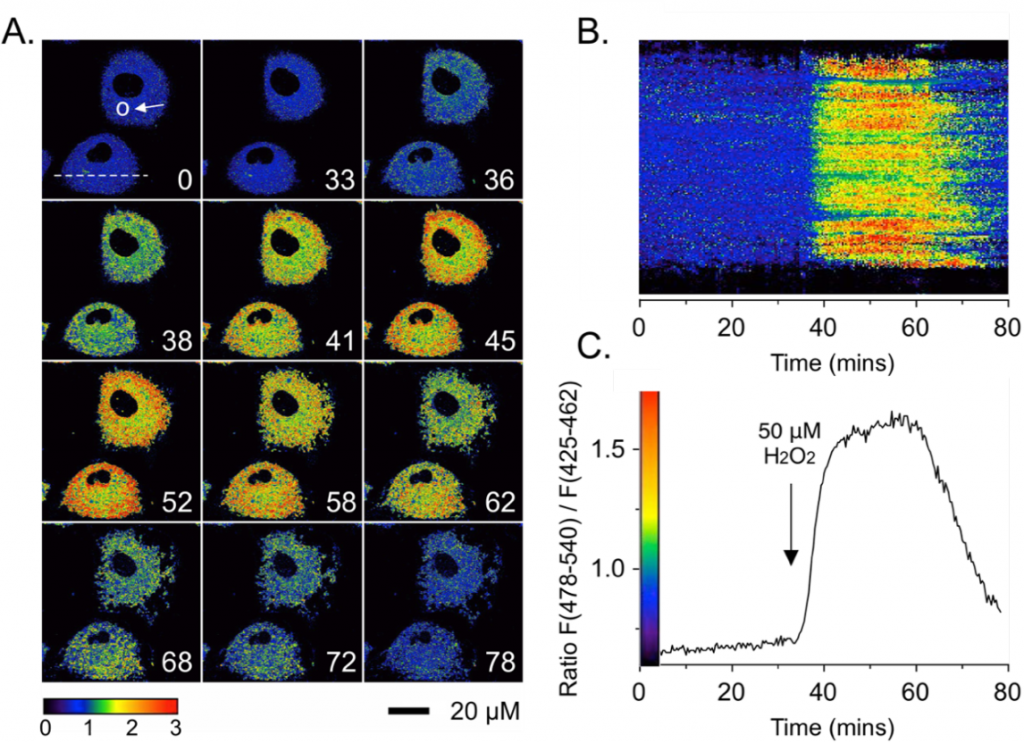
Ratiometric response to oxidative stress via H2O2. Two-photon excited ratiometric imaging of Zn(II) fluxes in live NIH 3T3 fibroblasts. Cells were pre-treated with 10 μM Chromis1-ester (30 min) and imaged in a temperature-controlled chamber using a Zeiss LSM710. The cells were then exposed to a buffer solution containing 50 μM H2O2. A: False color ratiometric images acquired at the indicated time points (minutes in lower right corner of images). B: False color ratiometric kymograph for the region of interest indicated by the dotted line in the upper left panel of (A). C: Average intensity ratio change vs. time from region of interest indicated by the white circle in the upper left panel of (A). Two-photon excitation occurred at 720 nm. Emission was collected between 425-462 and 478-540 nm.
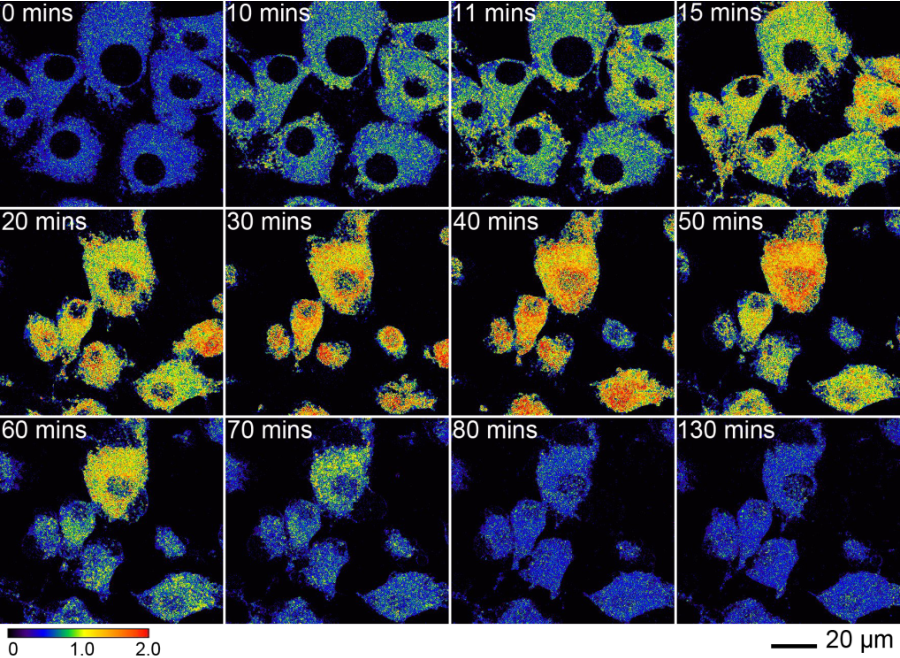
Ratiometric response to oxidative stress via DTDP. Two-photon excited ratiometric imaging of endogenous Zn(II) fluxes in live fibroblasts induced by DTDP. Cells were pre-treated with 10 μM Chromis1-ester (30 min) and imagined in a temperature- controlled chamber using a Zeiss LSM710. After 10 minutes of imaging under basal conditions, the cells were exposed to a buffer solution containing 100 μM DTDP. False color ratiometric images acquired at the indicated time points. Two-photon excitation occurred at 720 nm. Emission was collected between 425-462 and 478-540 nm.
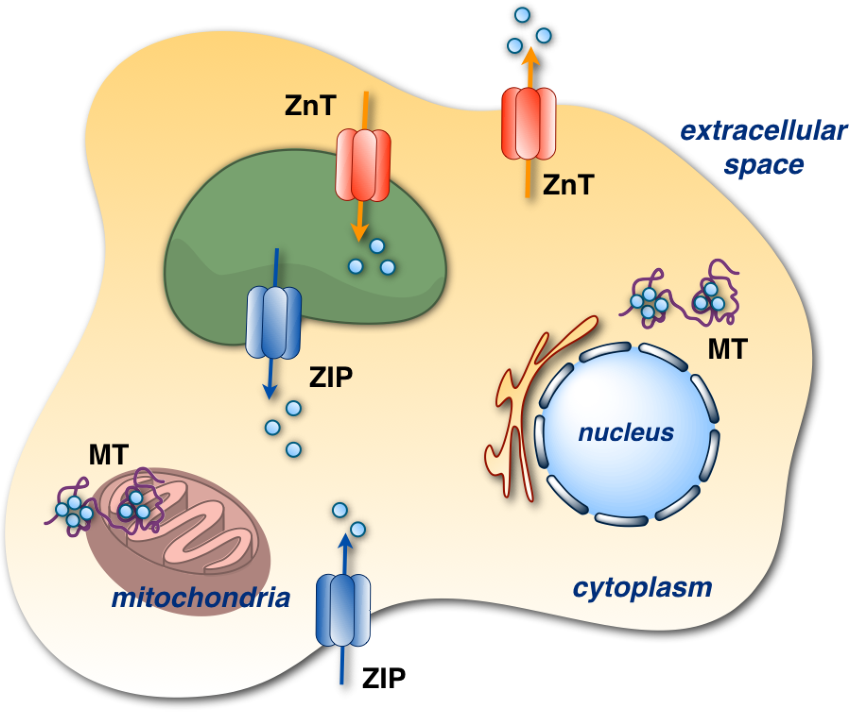
Distribution of zinc transporters. The ZIP family (blue arrows) is responsible for transporting Zn(II) into the cytosol and the ZnT family (red arrows) is responsible for transporting Zn(II) out of the cytosol. Seven zinc ions bind to metallothionein (MT) found in the mitochondria, cytosol or nucleus.
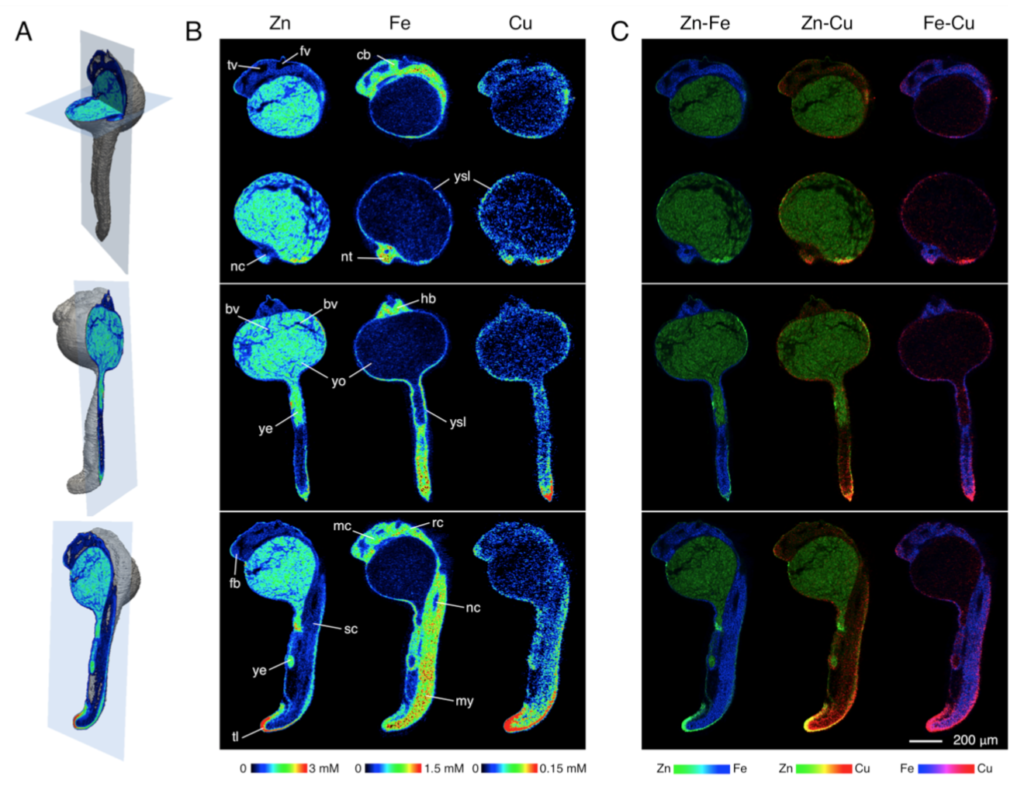
Visualization of elemental distribution in a zebrafish embryo (24hpf) by X- ray fluorescence tomography. Reconstructed using MLEM algorithm. A. 3D-rendering of the embryo indicating the spatial orientation of the virtual slices that are displayed in panels B and C. Slices include a sagittal and transverse section (top), coronal section (middle), and a second sagittal section offset to the left (bottom). B. Elemental distributions of Zn, Fe, and Cu for each of the 4 slices. Individual concentration scales for each element are displayed at the bottom of each column. Abbreviations: third ventricle (tv), fourth ventricle (fv), cerebellum (cb), notochord (nc), neural tube (nt), yolk syncytial layer (ysl), blood vessels (bv) hindbrain (hb), yolk (yo), yolk extension (ye), myosine (my), telencephalon (tc), mesencephalon (mc), diencephalon (dc), rhombencephalon (rc), spinal chord (sc) and tail (tl). C. False color overlays of the elemental distributions of Zn, Fe, and Cu indicating regions of spatial correlation. The concentration scales of each element were normalized and color-coded as follows: Zn (green), Fe (blue), and Cu (red). Areas of spatial correlation appear in the corresponding mixed hues.
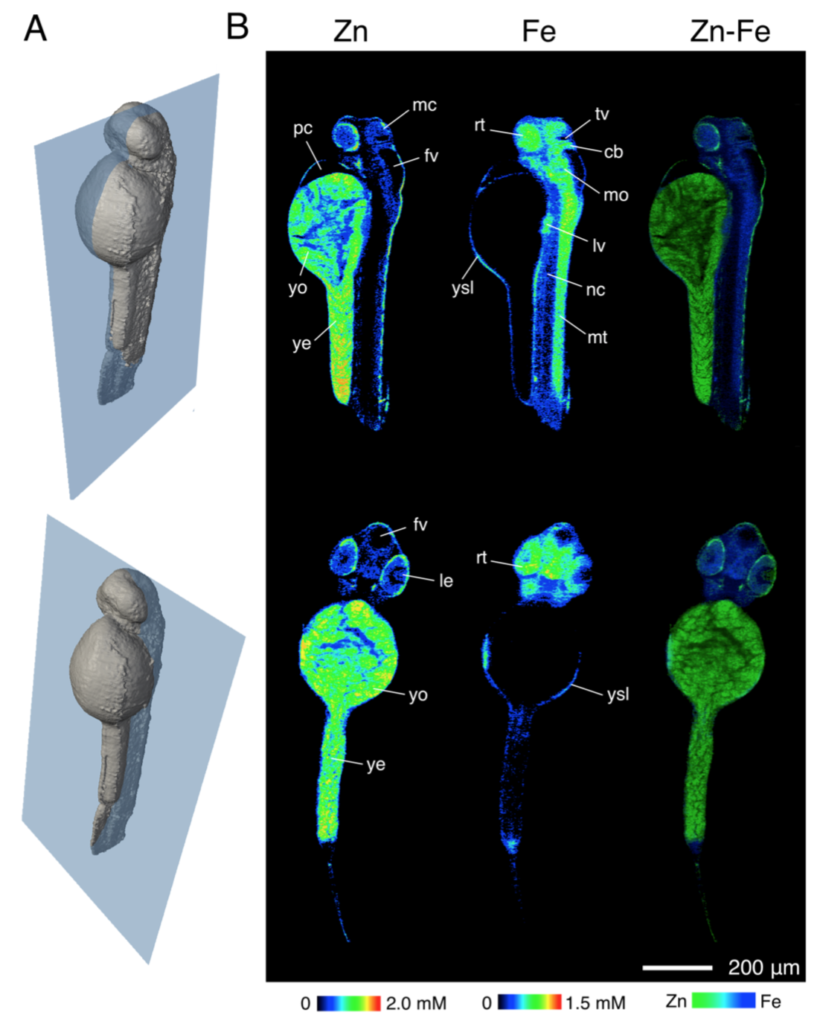
Visualization of elemental distribution in a zebrafish embryo (48 hpf) by X- ray fluorescence tomography. Reconstructed using MLEM algorithm. A. 3D-rendering of the embryo indicating the spatial orientation of the virtual slices that are displayed in panel B. Slices include a sagittal section (top) and a coronal section (bottom). B. Elemental distributions of Zn and Fe for each of the 2 slices. Individual concentration scales for each element are displayed at the bottom of each column. Abbreviations: Mesencephalon (mc), retina (rt), third ventricle (tv), cerebellum (cb), fourth ventricle (fv), pericardial cavity (pc), yolk (yo), yolk extension (ye), yolk syncytial layer (ysl), medulla oblongata (mo), liver (lv), notochord (nc), myotome (mt), and lens (le). The third column contains false color overlays of the elemental distributions of Zn and Fe indicating regions of spatial correlation. The concentration scales of each element were normalized and color-coded as Zn (green) and Fe (blue). Areas of spatial correlation appear in the corresponding mixed hue.

